Cardiac Physiology Review
CVSpecificMonitors{CV}
CVP
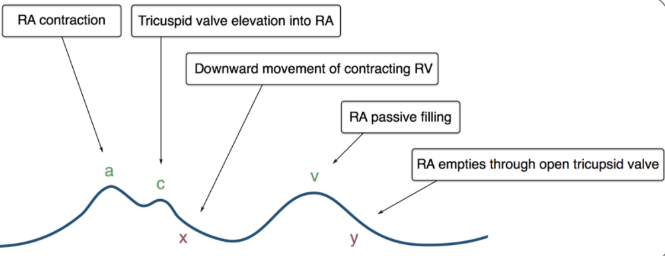
- Loss of a Wave:
- A fib or V pacing without atrial contraction
- Large a Wave:
- Atria emptying against high resistance
- Tricuspid stenosis, diastolic dysfx, ischemic heart, RVH, AV dissociation, junctional, V paced, PVC
- Large v Wave:
- Tricuspid regurg
PA Catheter
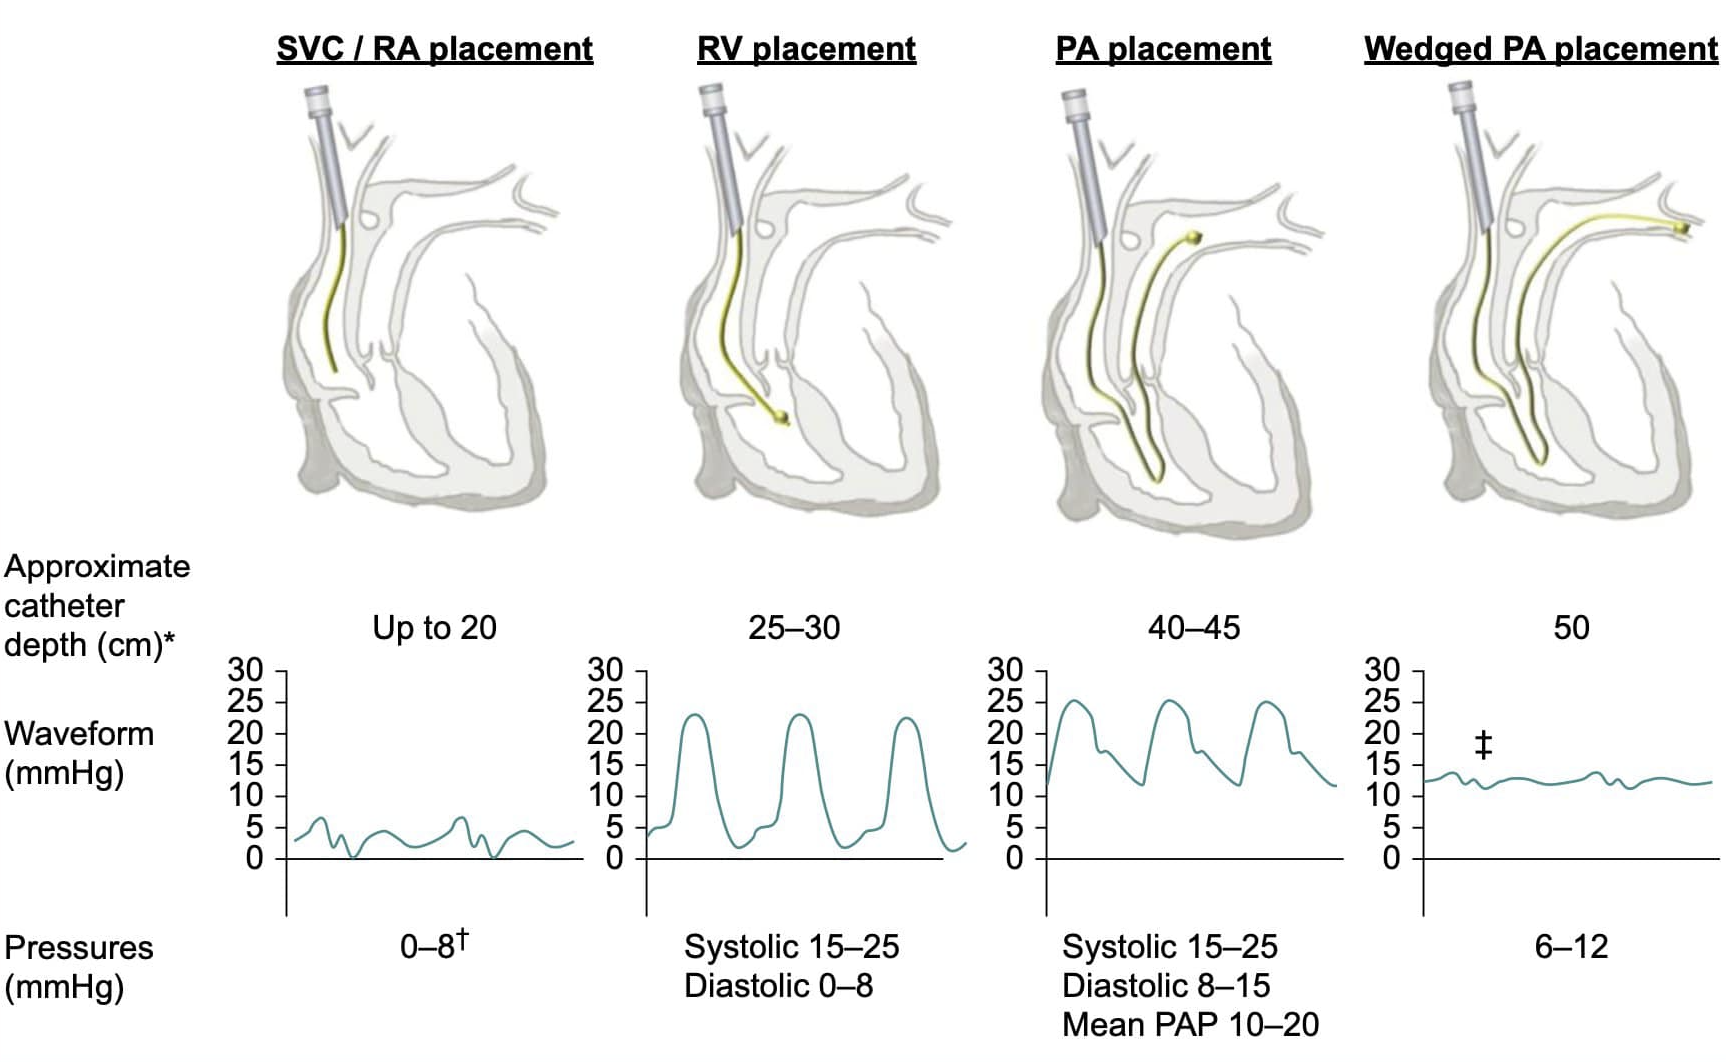
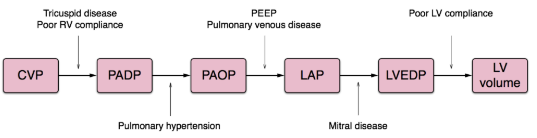
When PAOP Does NOT Predict LVEDV
- Overestimates
- Impaired LV compliance ie. ischemia
- Mitral valve disease
- Left to right cardiac shunt
- Tachycardia
- PPV
- PEEP
- COPD
- Pulmonary hypertension
- Non west zone III placement of PAC
- Underestimates
- Aortic insufficiency
SVO2 Interpretation
\[SvO_2 = {SaO_2} - {VO_2 \over 1.38 * 10 * CO * Hgb}\]flowchart
A[SVO2] --> C[High > 80]
A[SVO2] --> D[Low < 60]
A[SVO2] --> B[Normal 60-80]
C --> E[Anesthesia, Acidosis, Toxins]
D --> F[SaO2]
F --> G[Normal]
F --> H[Dec SaO2]
H --> I[Inc FiO2 and/or PEEP]
G --> J[Cardiac Output]
J --> K[CI < 2]
J --> L[CI > 2]
K --> M[SVV or similar]
M --> N[Low < 10]
M --> U[High > 10]
U --> V[Give Fluids]
N --> O[Inotropes]
L --> P[Hgb]
P --> Q[Low < 8]
Q --> R[Blood]
P --> S[Normal > 8]
S --> T[Analgesia vs Sedation]
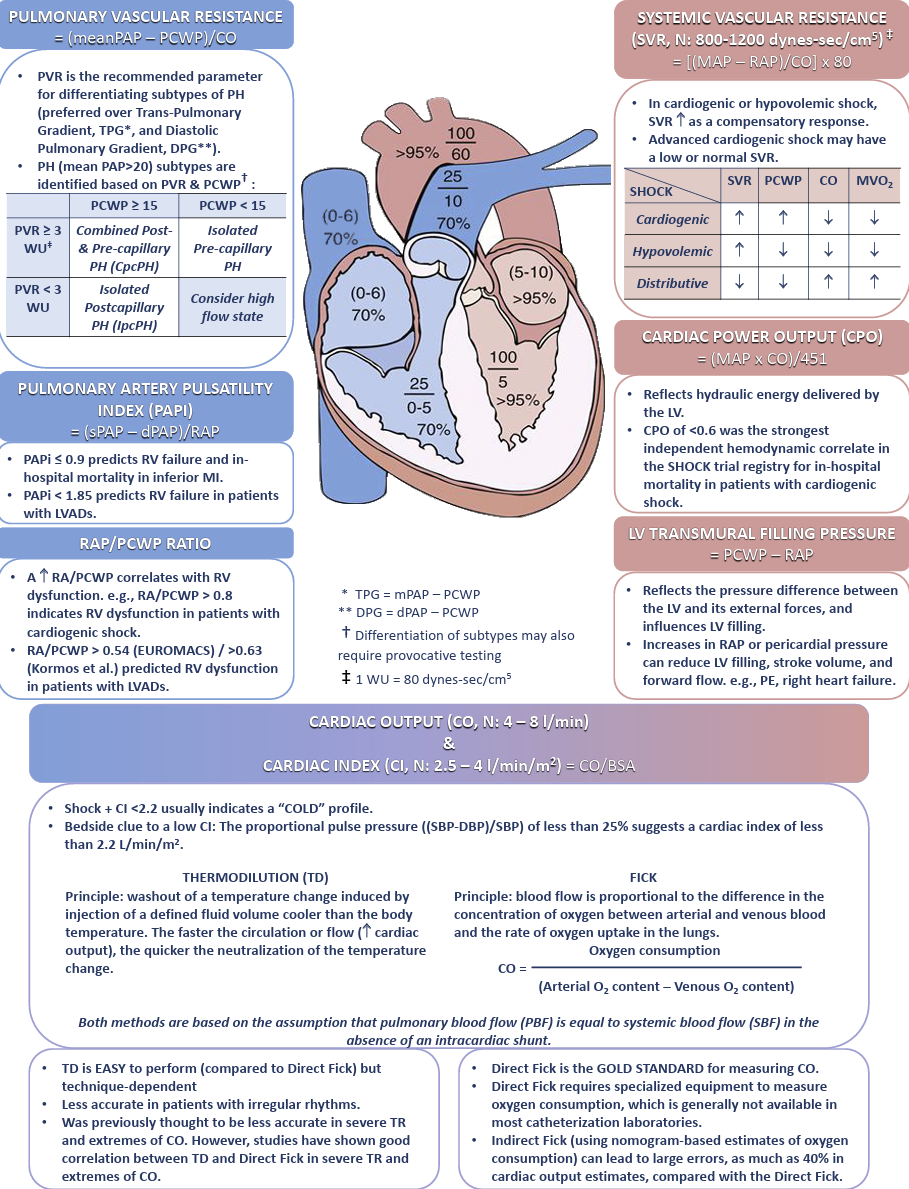
Systemic Vascular Resistance SVR
\[SVR = {MAP- CVP \over CO }{(80)}\]Cardiac and Respiratory
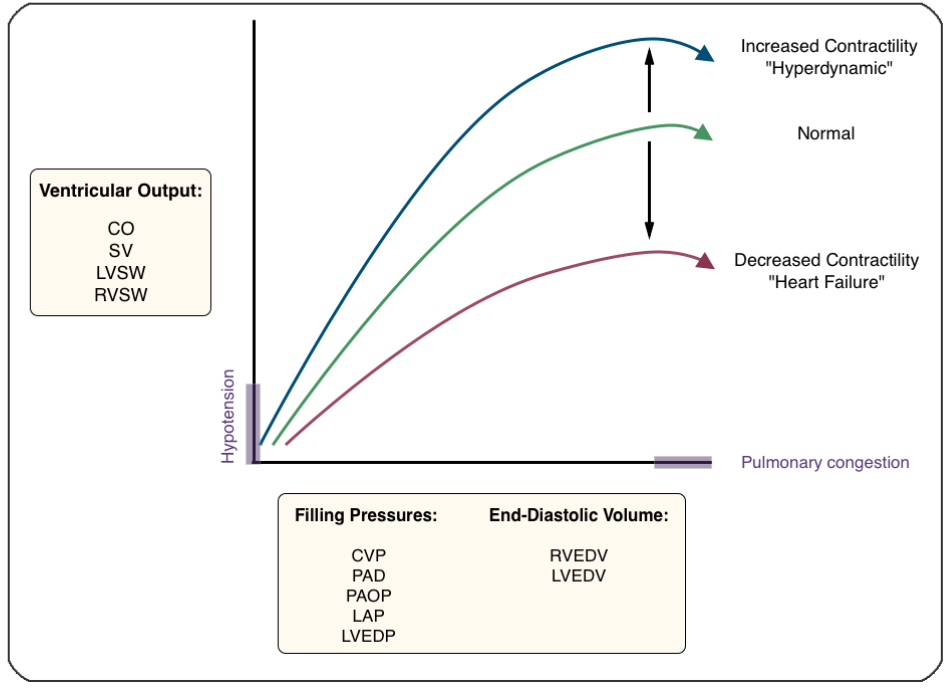
Starling Curve!
Ficks Law of Diffusion
Blood to organ can be calculated using a marker substance if the amount of marker uptake per time, concentration venous and arterial of marker are known.
\[CO = {\dot VO_2 \over Ca - Cv} = {(125ml/min) * (BSA) \over CaO_2 - CvO_2}\] \[Oxygen Carrying Capacity = CaO_2 = {(Hgb * SaO_2 * 1.34) + (PaO_2 * 0.003)}\]Law of Laplace
Arteries and AAA
The assumption is that the structure described is cylindrical.
\[Wall Tension (Cylinder) = {Pressure * Radius \over Wall Thickness}\]Left Ventricle and Alveoli
The assumption is that the structure described is spherical. Surfactant does help to lower the surface tension in the alveoli.
\[Wall Tension (Sphere) = {Pressure * Radius \over 2 * Wall Thickness}\]Poiseuille’s Law for Flow or Resistance
The original law was presented for flow through a cylinder. If the equation is rearranged it represents resistance through that cylinder. Both are described below.
Flow
\[Q = {\pi r^4 \over 8L\eta }{(\Delta P)}\]Resistance
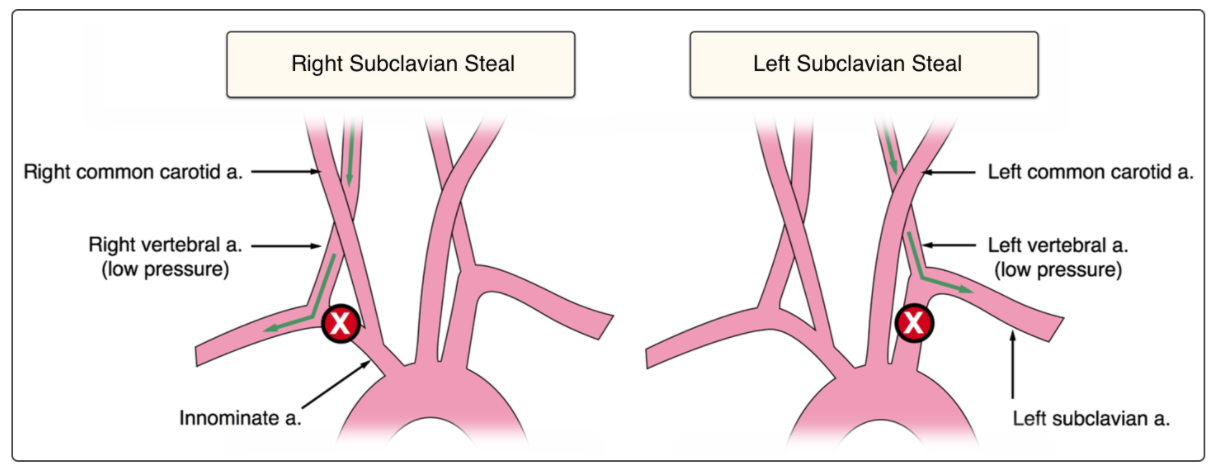
\[R = {8L\eta \over \pi r^4 }{(\Delta P)}\]Subclavian Steal
EKG
EKG Basics
For a great video lecture series about 2.75 hrs long check out EKG interpretation Video Lectures
The Rule of Fours
Four Initial Features
History and Clinical Picture
Clinical picture is arguabley the most important part. History taking is also important but clinical features can be quite informative.
Rate
Normal 60-100. Not too fast or too slow!
Rhythm
Hopefully sinus…but it can be anything! How do you know? First it’s a good idea to know some rhythms and then work through the EKG in an organized manner. You already have the rate so it’s fast, slow, or normal. Next:
- Regular or irregular R-R
- P wave with every QRS
- QRS with every P
- PR interval
- QRS Interval
- Ectopy
- Identify!
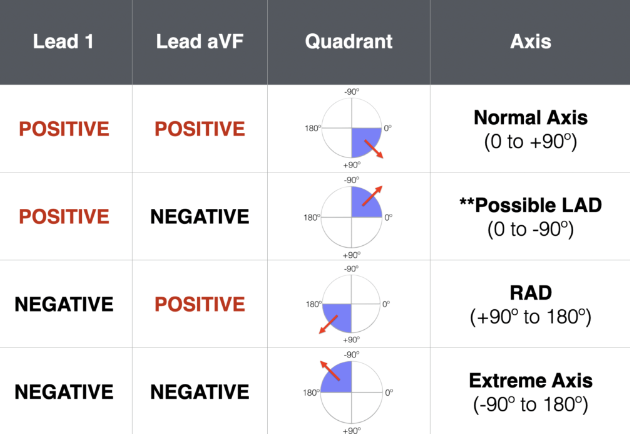
Axis
Normal axis is -30 to + 90.
Axis Deviation In Depth
Check out Life In The Fast Lane for tons of EKG knowledge and examples!
For an in depth analysis of axis deviation check out EKG Axis Interpretation
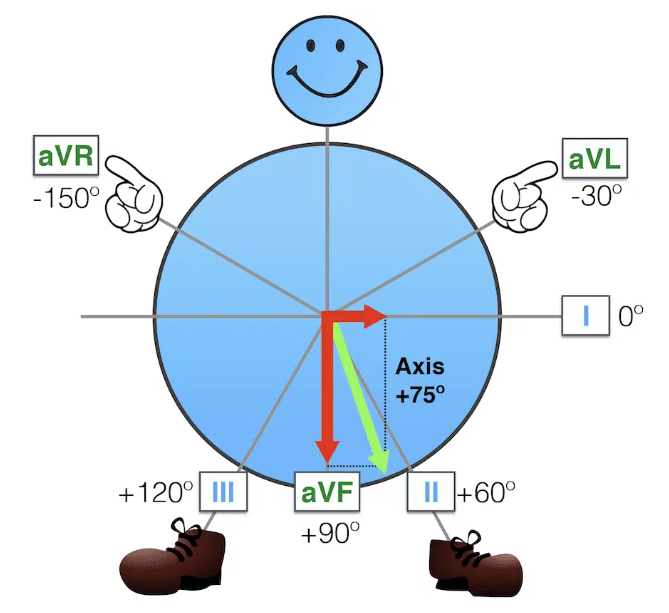
Ever wonder how the axis is calculated? You use the axis circle and draw vectors. These vectors are summed using the x intercept and the intersection point on the circle. This new vector is the axis deviation! For a thorough explanation and more examples check out Super Axis Man SAM
Four Waves
P
Check out lead II for the best P wave morphology!
QRS
Look in all leads for the presence of Q waves. Also note the QRS amplitude and R wave progression in leads V1-V6.
T
Look in all leads for the presence of T waves. Be sure to note any inverstion, flattening, and the concordance vs discordance with the QURS complex.
U
Are the U waves present or not?
Four Intervals
PR
Normal is 0.12-0.2 seconds or 3-5 little squares. Longer means a first degree heart block, but shorter can be mean WPW, junctional rhythms, and some syndromes.
QRS
Normal is 0.12seconds or less or less than 3 little squares. Widened QRS indicates a conduction defect or delay.
ST
This can be the most important thing at which to look!
QT
Easiest to use the EKG machine measurements and ensure it is not prolonged! ( QT > 450)